
Evaluating impact
How we measured the effectiveness of ThisHasToStop
It was essential for Redbridge Council to be able to understand whether ThisHasToStop was effective, so evaluating the project’s impact was a critical part of our planning from the outset.
Impact measurement begins with clarity around what an initiative is trying to achieve.
We identified three main areas where we wanted the project to have impact:
Crime and safety: reduce sexist and violent crimes, so women and girls feel safer on the streets and in their homes.
Knowledge and awareness: Increase understanding of sexism, misogyny and harassment, as well as knowing how to tackle them.
Attitudes and behaviours: Shift attitudes, challenge social norms and change how people respond to sexist behaviour.
Having identified where we wanted impact, the next stage was to work out what type of information would tell us whether progress had been made in these three outcome areas. We identified three or four metrics for each area that would give us a really good understanding of whether our aims had been achieved and then the next step was to consider how to collect the information we wanted. This included:
Administrative data
This was data that was already available or routinely collected, such as Police crime data and other relevant national, regional or local sources, such as ONS research, British Social Attitudes surveys, and OFSTED pupil surveys.
Monitoring data
This was information that could easily be collected as part of the project, enabling us to capture details such as the distribution of, and engagement with, ThisHasToSTOP resources.
Having identified where we wanted impact, the next stage was to work out what type of information would tell us whehter progress had been made in these three outcome areas.
‘
Primary research
This is the data we would capture directly from the local community through direct engagement, giving us information on attitudes and perceptions.
We wanted to make sure that our approach to evaluating the impact of ThisHasToStop was proportionate and manageable, which meant keeping the need for primary research to a realistic level.
Our primary research focused mainly on hearing from people who have participated in, engaged with or used resources and information produced as part of ThisHasToStop. We did this through a combination of surveys, interviews and focus groups with target audiences.
Simple before-and-after measures have a built-in weakness – you can’t be sure that any change you can see was caused by the initiative itself or by wider forces, such as policy, national and regional government actions, media coverage or wider societal shifts.
We looked at ways to overcome this problem by using comparison groups. These groups served as a counterfactual, which is a set of data that tells us what may have happened without our involvement. By placing our monitoring data alongside the counterfactual, we would be able to get a better understanding of the difference that ThisHasToSTOP had made.
So we used two broad types of comparison data. Firstly, we compared the outcome data from Redbridge with figures from other places. Secondly, we compared the attitudes of programme participants with those who had not taken part. These two comparisons enabled us to isolate the impact of our activity from other influences.
For Redbridge this involved comparing crime data with figures from London as a whole and surveying young people who had taken part in ThisHasToSTOP initiatives alongside those who had not, so that our data set would have comparators built in.
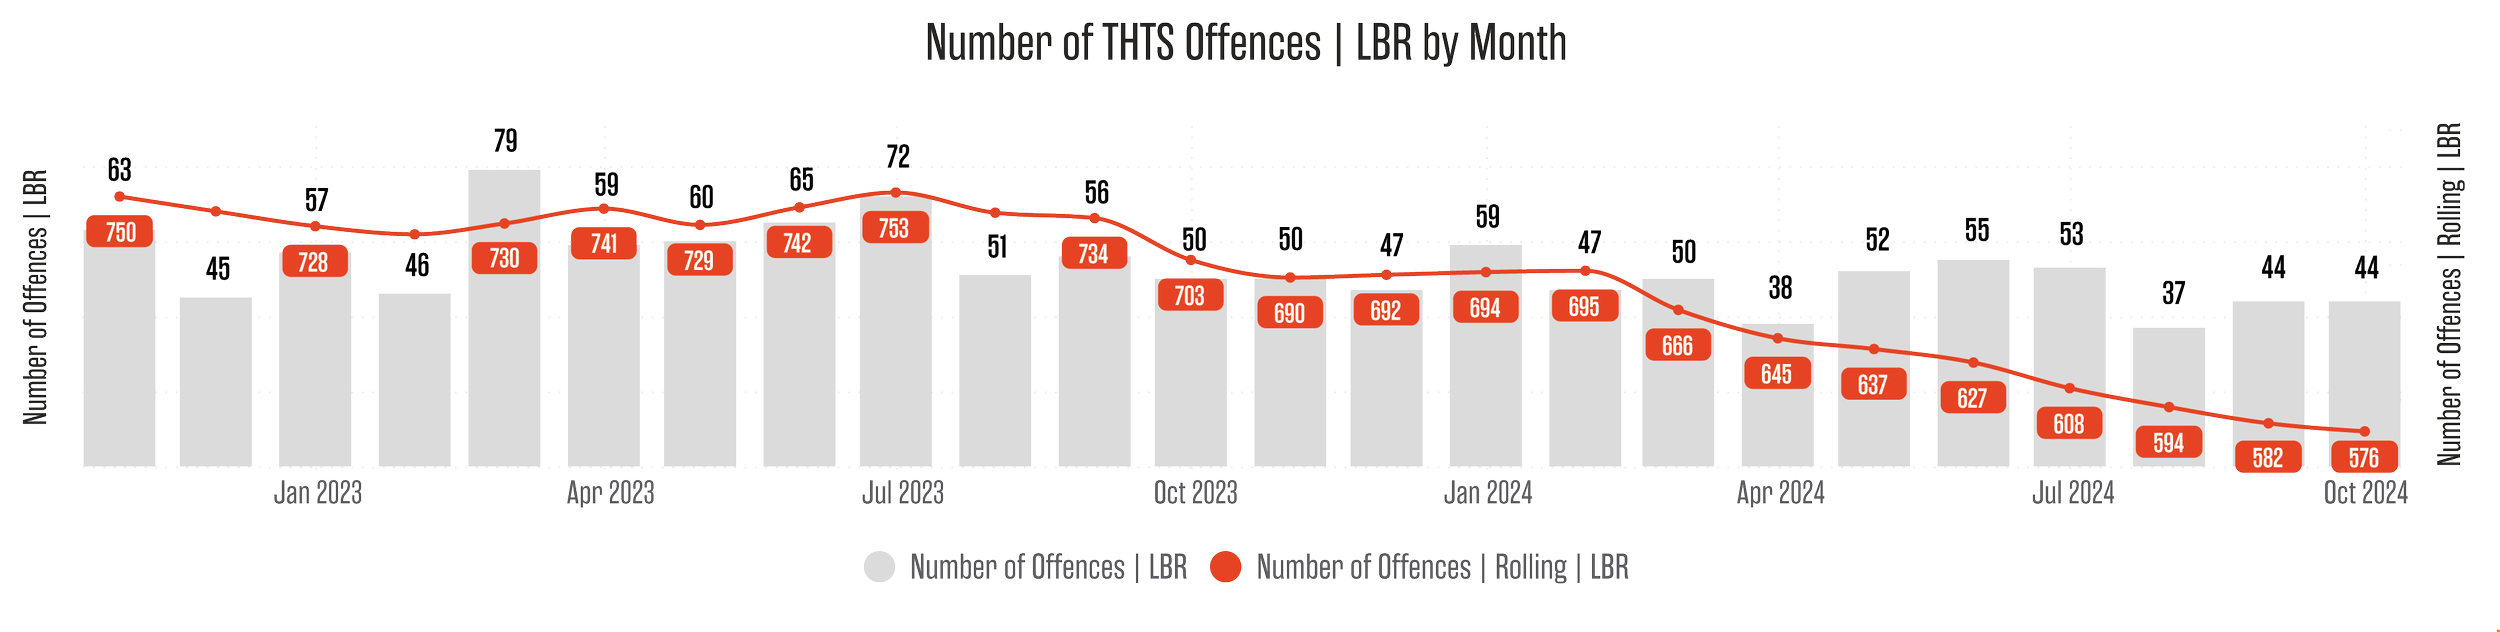
ThisHasToSTOP cut recorded offences by twice as much as other London boroughs during the same period.
‘
The impact in Redbridge
Taking the approach described here gave us confidence that ThisHasToStop had a significant impact.
Over the first year of the programme Redbridge saw a fall of 21% in ThisHasToStop-related offences. This was more than double the 9.5% reduction seen across London as a whole. Similarly positive reductions were seen in neighbouring boroughs - Barking and Dagenham and Waltham Forest. Though we cannot be sure, given the porous nature of borough boundaries, it seems reasonable to assume that many residents of neighbouring boroughs would have been exposed to ThisHasToStop campaign materials, driving this sub-regional variation.
In schools, too, we saw real differences between our participating schools and those that didn’t, with students who had taken part significantly more aware of sexism and misogyny at school. In our pilot schools, this attitudinal difference was supported by an increase in students reporting sexist incidents, underscoring a greater sense of awareness. Of course, we would expect this figure to fall over time, but a short-term increase can be regarded as a positive sign as students’ awareness grows. Meanwhile, teachers were overwhelmingly positive about the new classroom resources and students demonstrated high levels of key message recall around what to do as a bystander.
We saw real differences between our participating schools and those that didn’t.
‘
Using a counterfactual
Many traditional evaluation methods measure change over time – taking a baseline measurement before we commence our activity and then comparing it with findings after we’ve completed our work.
The limitation with this approach is that it fails to take account of other factors which may have resulted in things changing but are not things we have done – like wider policy changes, environmental factors, things other agencies have done.
A counterfactual tells us what would have happened without our involvement, and enables us to understand what difference our actions have had.
In relation to engagement, this means that we need to determine, are people who engaged with our activity any better off as a result of their experience? This doesn't necessarily mean doing exactly what people suggest –that may not always be possible or practical, and different people will have different opinions – but it does mean being transparent about our decision-making and why we've taken the approach we have.
We can use a counterfactual by comparing the perceptions, attitudes or outcomes of those who were involved in the engagement opportunity with those who were not, to see if they have different experiences. By comparing these two groups we can more reliably separate the difference we’ve made from other factors that may have influenced changes.
The simplest way to introduce a counterfactual is to have a comparison group who is not engaged, but similar to those who were – and to measure their views, experiences or outcomes in parallel. More complex (but robust) approaches include running Randomised Controlled Trials, or other experimental evaluation methods, which are considered the ‘gold standard’ in evaluation.
A counterfactual tells us what would have happened without our involvement, and enables us to understand what difference our actions have had.
‘